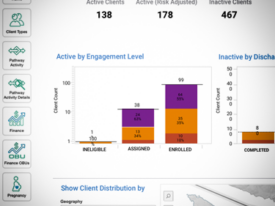
Data Visualization — Tableau The power that drives care coordination is through data reporting. We developed a series of dashboards that allow agencies to visually understand how their work is progressing quickly and easily.
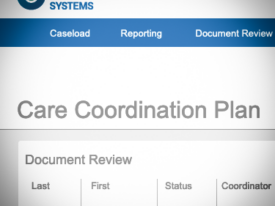
Community Health Record Redesign With increased traffic and use, the ux/ui needed to be brought up to date to support the advanced data features this web application provided.
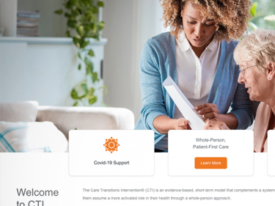
Care Transitions Intervention A new product for Care Coordination Systems, Care Transitions Intervention offers training and team support for care transition coaches. Phase...
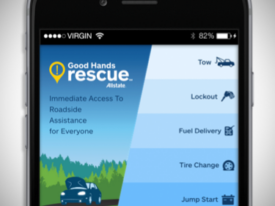
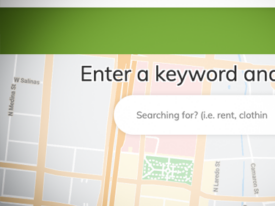
Allstate Good Hands Rescue Allstate set out to create a responsive web app that was easily accessible through search engines while the customer was in the moment of need...
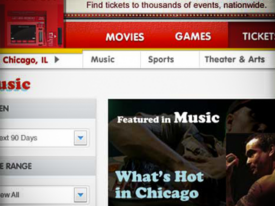
Redbox Tickets — Live Events Redbox invested into a new area to automate entertainment sales — Live Events. Working as both Product Manager and UX Architect...
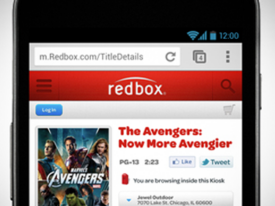
Redbox Quick Reserve The initial request was to make the weekly email marketing campaign easier to read on mobile devices. We went a...
HealthBridge.care™ HealthBridge.care focuses on connecting people to community resources. The website creates a bridge between individuals and community resources...
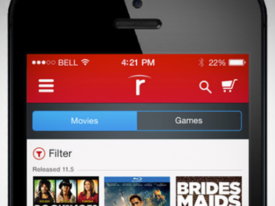
Redbox iOS Redesign With the the new Apple iOS 7 release, all apps in the App Store needed to update their applications to correspond to the new operating system.